
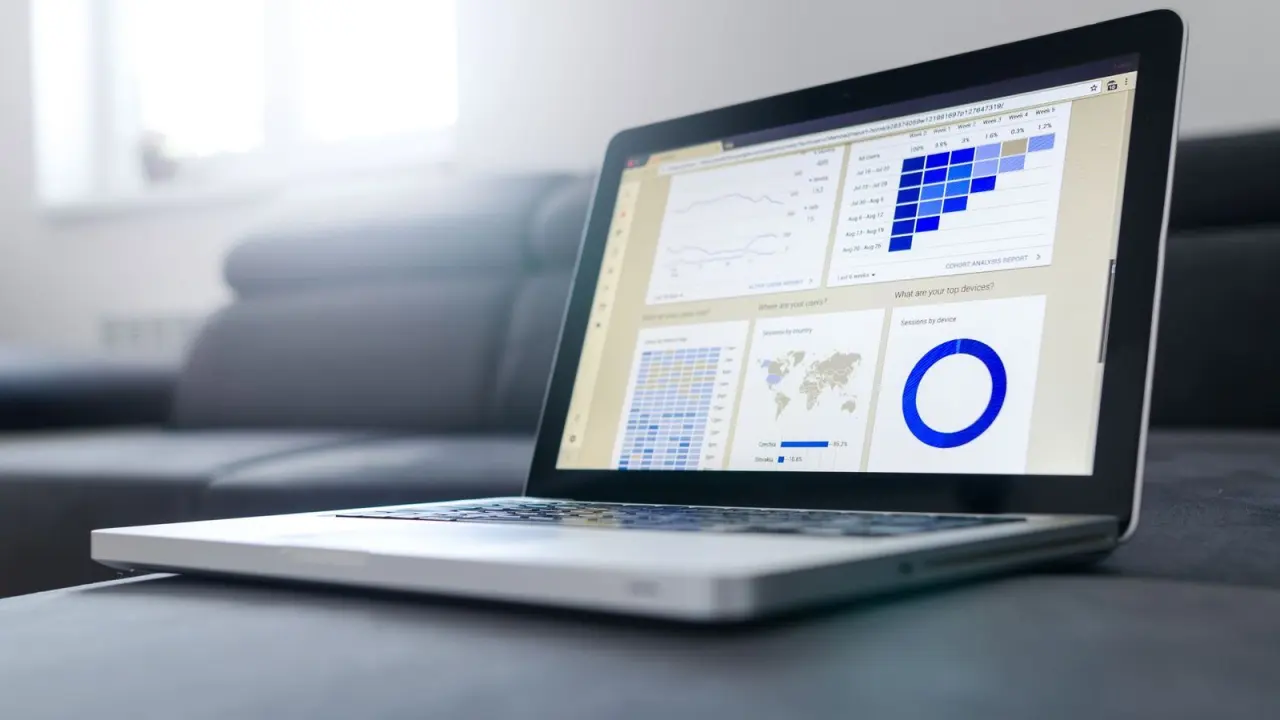
Not sure what people really do in your app? With mobile app analytics you can see who uses it, what they tap and where they quit. Start with a few engagement and stability numbers.
This page is part of a wider look at mobile app strategy for business, so read it alongside your planning.
| Item | Value |
|---|---|
| Engaged session length | 10 seconds or longer |
| User activity windows | 30 days, 7 days and 1 day |
| Realtime activity window | Last 30 minutes |
| App versions shown in the Users by App version card | Top 5 |
| Funnels removed from Analytics for Firebase | December 2021 |
The figures come from Google’s help pages on the Firebase overview report and on Google Analytics 4 functionality in Firebase. They can change, so check the sources before you rely on them.
What does mobile app analytics measure?
At its simplest, mobile app analytics records what people do in your app and turns it into numbers you can compare over time. Google describes its Analytics product as a way to “gain insights into user behavior, and optimize your app’s marketing and performance”, according to the Firebase documentation.
Good analytics answers plain questions about your product:
- How many people used the app in the past day, week and month?
- Which app versions are they running?
- Do sessions end in crashes?
- Which actions lead to the outcomes your business cares about?
When you connect your app through the Google Analytics for Firebase SDK, the Firebase overview report appears under the App developer collection in Google Analytics. Google’s help page on the Firebase overview report describes it as a summary of engagement, revenue and release success.
Engagement metrics worth watching first
The User activity over time card shows how many people used your app in the past 30 days, 7 days and 1 day. It counts only users who engaged with your app in the device foreground, according to the overview report help page.
Compare the short window with the long ones. If the one-day number begins to trend downwards, Google notes you could expect fewer users over the past 7 and 30 days in the near future.
Next, look at engaged sessions. Google defines an engaged session as one that lasted 10 seconds or longer, or had 1 or more key events or 2 or more page or screen views. That filters out accidental opens that would otherwise inflate your session count.
Average engagement time is the time your app was in the foreground, divided by the number of active users. Be careful reading the chart: the figure in the tab may be greater than any single point in the chart, because the tab divides by users across the whole period.
Google’s own example makes this concrete. One user spent a total of 8 minutes in the app in July and another spent 10 minutes, so the tab shows an average of 9 minutes, as the help page explains.

Events you get without writing extra code
Analytics records automatically collected events from basic interactions with your app. As long as you use the Google tag or the Google Analytics for Firebase SDK, you don’t need to write additional code to collect them, according to Google’s automatically collected events list.
Several of these events tell you something useful about product health:
- app_update fires when the app is updated to a new version and launched again, and it passes the previous app version.
- app_remove fires when an application package is removed from an Android device.
- app_exception fires when the app crashes or throws an exception, and it is sent when you integrate Firebase Crashlytics.
Be careful comparing uninstall numbers. The app_remove event counts removals regardless of the installation source, so it can differ from the uninstall metrics in the Google Play Developer Console, per the same events page.
Every event also carries default parameters. For an app stream these include app_version, firebase_screen_id and firebase_screen_class, and the value you assign to an event parameter must be 100 characters or fewer.
Reading stability and release data
The App stability overview card shows the percentage of users who experience crash-free sessions for each app, plus the change over the previous time range. Exceptions logged on Android through Firebase Crash Reporting’s report API count as crashes, and Google advises updating to Firebase Crashlytics for better accuracy.
Two more cards help after a release. Users by App version shows the top 5 most interacted-with versions in your date range, and Latest app release overview shows the status of the latest release of each version, such as Android and iOS.
A simple routine after each release:
- Check Users by App version to see whether people are moving to the new build.
- Check the crash-free sessions figure against the previous period.
- Open the latest release overview for the platform you shipped.
- Look at engaged sessions per active user to see whether behaviour changed.
For live checks, the Active users in last 30 minutes card draws on the Realtime report and shows activity as it happens.
Retention, funnels and revenue signals
Firebase’s reporting moved closer to Google Analytics 4 in stages. As of Google’s October 13, 2021 alignment, retention data is visible in the Dashboard under the User activity by cohort card.
The Funnels feature was removed from Analytics for Firebase as of December 2021. Google’s guidance is to use the funnel exploration technique in Google Analytics 4 Explorations instead, per the Firebase help page on the change. That page also notes that attribution is set by default to “cross-channel last click”.
Subscription apps get extra automatic events. For example, app_store_subscription_convert fires when a free-trial subscription converts to a paid one. Google’s events list says it only applies to subscriptions first made on or after the date July 1, 2019.
If you are still choosing how your app earns money, compare mobile app monetization models before deciding which revenue events to track.
Keeping analytics tidy and safe
Track what you will act on. A short list of events tied to real decisions beats a dashboard nobody reads, and fewer custom events are easier to keep consistent.
Limit who can change your reports. Administrators and editors can change the summary cards in the overview report, so you may see different cards from a colleague’s view.
Behavioural data about people also needs protecting. Pair your analytics setup with mobile app security best practices, and keep personal details out of event parameters.
Frequently asked questions
What counts as an engaged session?
Show answer
Per Google’s overview report help page, it is a session that lasted 10 seconds or longer, or had 1 or more key events or 2 or more page or screen views.
Do I need extra code to collect basic events?
Show answer
No, not for automatically collected events. As long as you use the Google tag or the Google Analytics for Firebase SDK, Google says you don’t need to write additional code for them.
What happened to funnels in Analytics for Firebase?
Show answer
The Funnels feature was removed as of December 2021. Google says to use the funnel exploration technique in Google Analytics 4 Explorations instead.
How do I see who is using my app right now?
Show answer
Use the Active users in last 30 minutes card in the Firebase overview report. It uses data from the Realtime report to show activity as it happens.